In the world of sports, statistics are virtually inescapable. Nowhere is this truer than in baseball. Even the most casual fan is familiar with basic statistics: batting average, home runs, RBI. On the other end of the spectrum are sabermetricians, who use more complex methods to evaluate players and teams. Over the last 30 years, statistical analysis of baseball has evolved to a point where metrics such as VORP (Value Over Replacement Player), EQA (Equivalent Average), and FRAA (Fielding Runs Above Average) are regularly used as evaluation tools in many Major League Baseball front offices.
This is not to say baseball has been taken over by statisticians. When Paul DePodesta, a disciple of statistics-reliant Oakland general manager Billy Beane, was named GM of the Los Angeles Dodgers, he failed to yield immediate results and was fired. His replacement, Ned Colletti, emphasizes scouting over statistics.
I am a stats person. Maybe that isn’t surprising considering my computer science major. Advanced metrics, when used properly, can tell you all sorts of things you wouldn’t realize otherwise — Derek Jeter has never been a particularly good defensive shortstop, for instance (-107 FRAA for his career). I have a deep appreciation for the work of noted sabermetricians such as Bill James and Rob Neyer.
The problem with statistics, of course, is their ability to deceive. When Alex Rodriguez went 1-for-14 in the 2006 ALDS, every offensive statistic known to man would paint him as a poor batter — for that series. Sample size is critical. So is knowledge of the environment where statistics are generated. Hall of Fame pitcher Nolan Ryan had an ERA of 3.09 for the Mets in 1968 — excellent by today’s standards, but mediocre compared to the league average ERA of 2.98 in the National League in 1968. Ryan couldn’t even get into the Mets’ rotation.
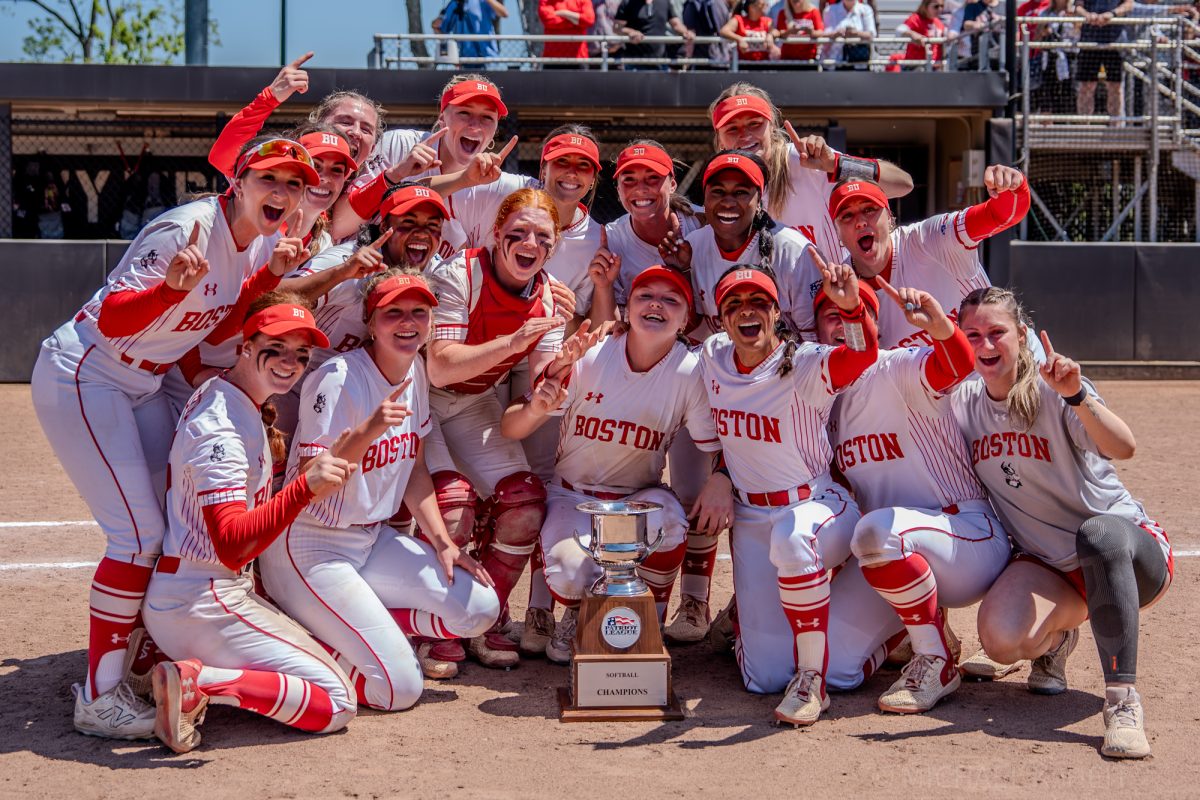
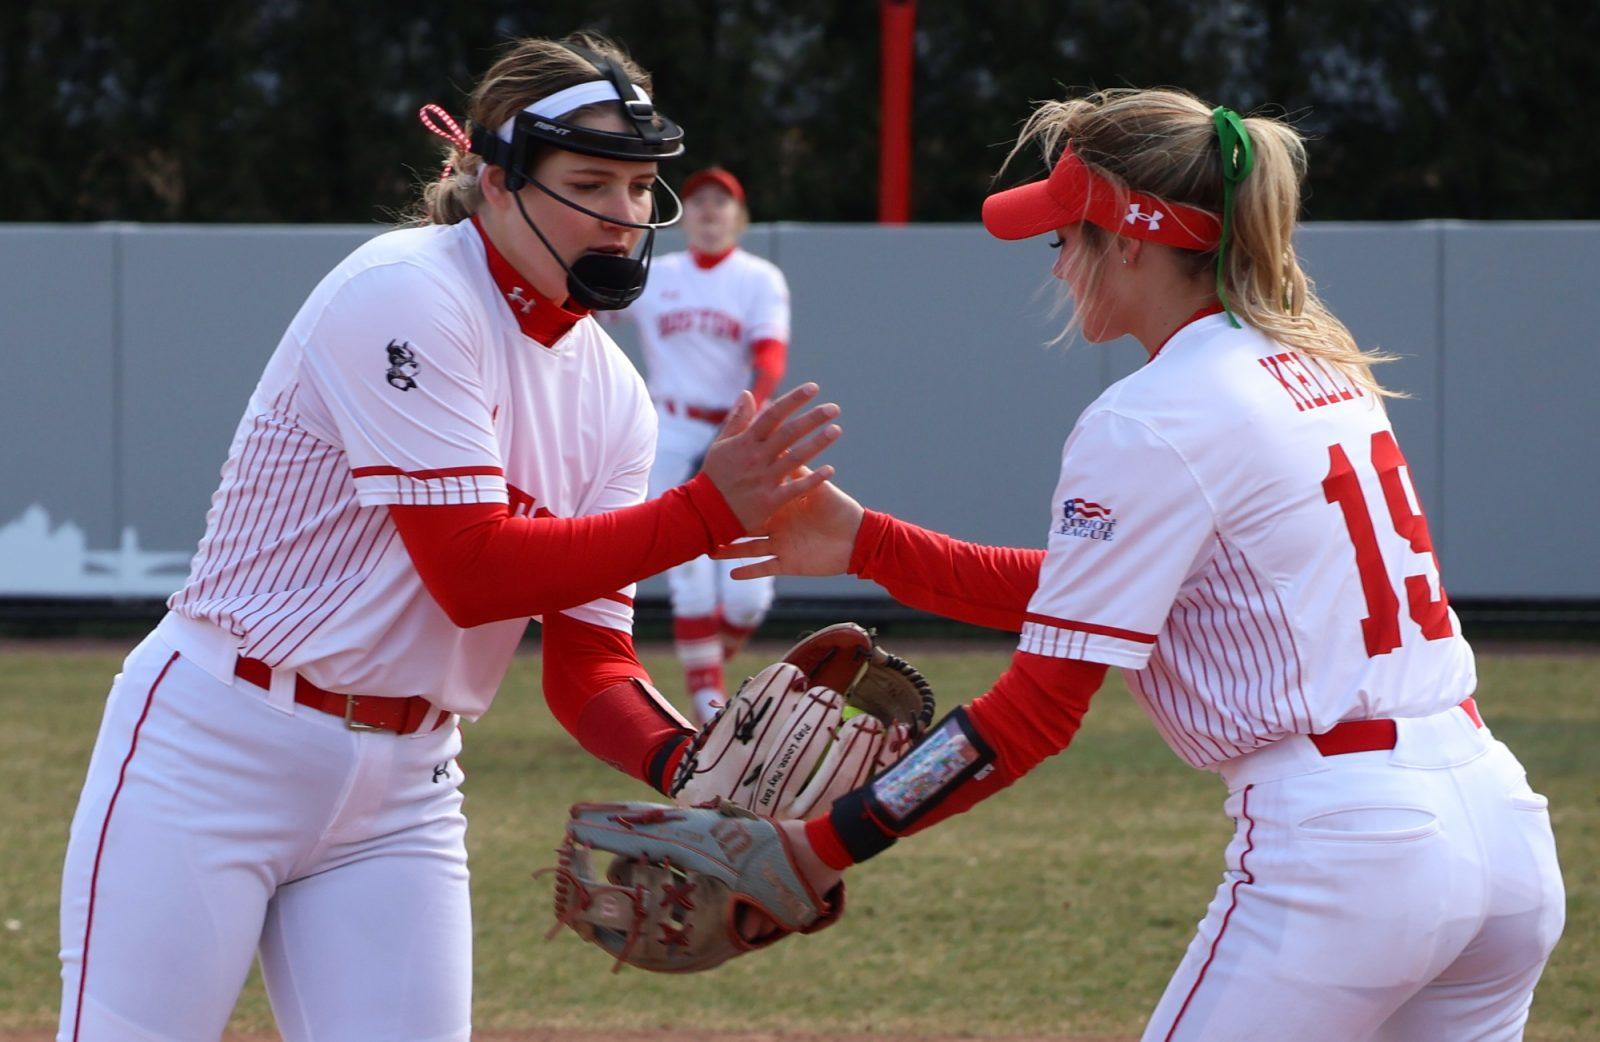
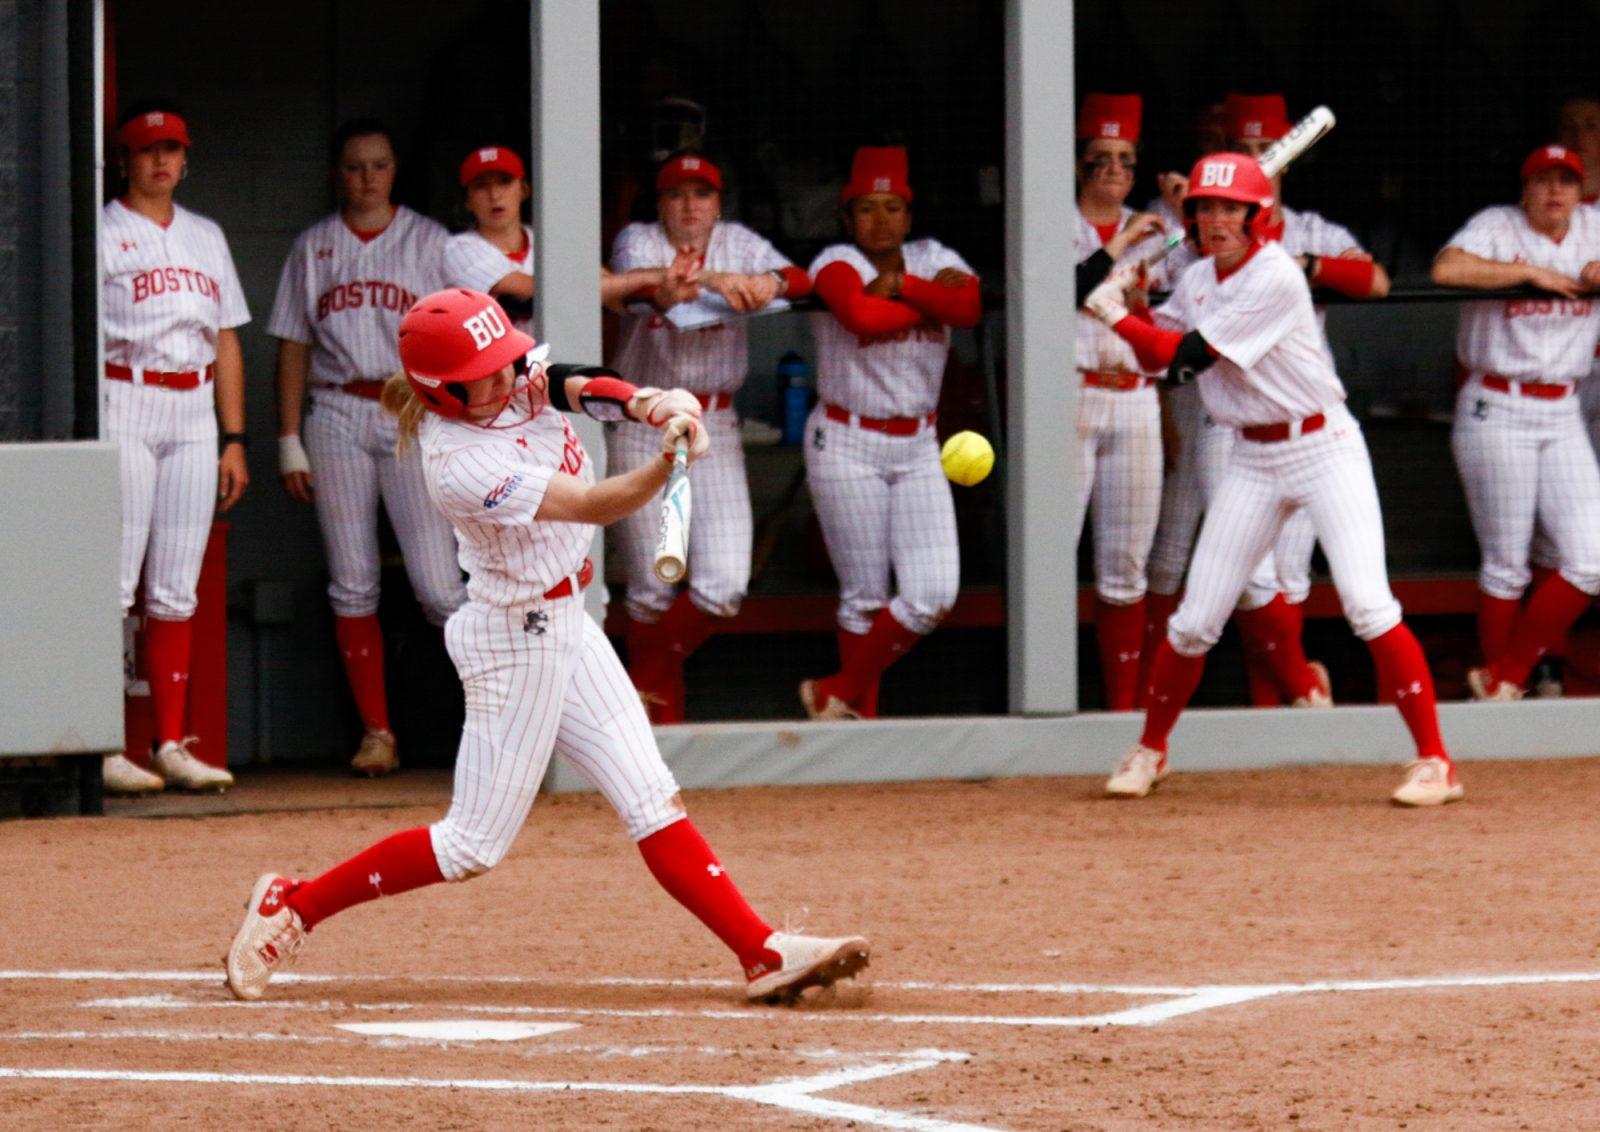
Softball and baseball share statistics as a common thread. This is useful when looking at the Terrier softball team’s performance thus far this season. Clearly, a team sitting 11 games over .500 with a 12-3 record in conference play is doing something right. While the lack of statistical analysis for softball makes it difficult to implement environment-dependent metrics such as VORP and EQA, the available raw data is sufficient for painting a picture of BU’s season to date.
The Terriers’ offense, though capable, is a far cry from last year’s dominant unit. The Terriers are fourth in OPS (On-base Plus Slugging) at .720, with their .349 on-base percentage contributing to their third-place conference rank in runs scored. BU’s offensive successes have largely been due to its healthy on-base percentage, a product of its patience at the plate — the offense boasts a conference-best 128 walks.
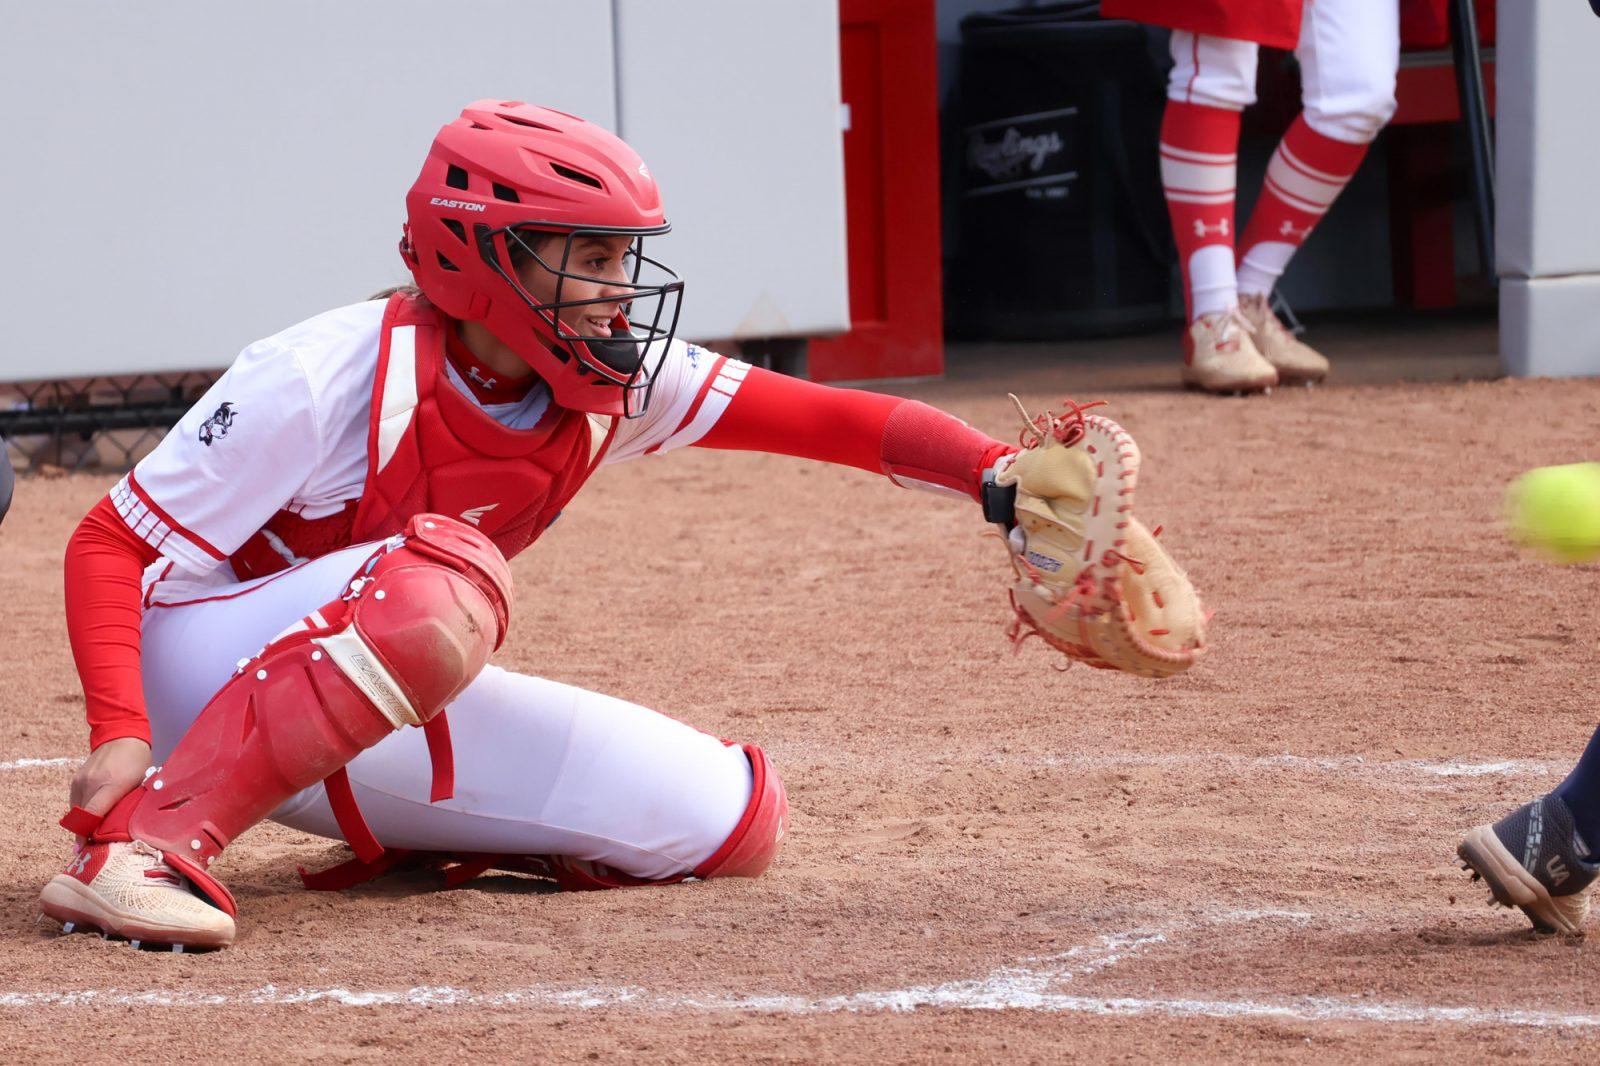
While the Terriers certainly know how to get runners on base, BU has totaled only 76 extra-base hits this year. Last year, the Terriers hit a combined 76 triples and home runs, with nearly that many doubles, resulting in a .515 SLG (slugging percentage). Part of this drop off was expected, as BU sluggers Chiya Louie and Brandi Shields graduated in 2007. The remainder can be attributed to a decline in output from returning players. Christy Leath’s incredible .620 SLG last year — as a catcher! — is only .349 this year, more typical for a backstop.
Despite the decrease in slugging, Leath and others have found ways to get on base and score runs frequently. Those runs have provided more than enough supports for BU to win games.
The reason is pitching. Terrier pitchers Cassidi Hardy, Megan Currier and Kelley Engman have compiled a 2.82 ERA as of yesterday, a slight improvement over an ERA of 2.84 last season. Terrier pitching encountered a speedbump in yesterday’s 13-9 loss to Maine, but for the most part the pitchers have been solid.
Fielding is more difficult to evaluate statistically than hitting and pitching. BABIP (Batting Average on Balls In Play) may offer a hint at how the Terriers have done defensively. If BABIP is any indication, BU’s defense is rock-solid. As of yesterday, only 26 percent of batted balls in play resulted in hits for Terrier opponents. When combined with the Terriers’ high fielding percentage, one finds the Terriers are converting more than 70 percent of batted balls in play into outs. Compared to the league average BABIP of .305, BU’s BABIP is incredibly low.
Teams with low BABIPs usually have fly-ball pitchers. If the Terrier pitchers were predominantly fly-ball pitchers, their BABIP would not be an indicator of solid defense. The statistics, however, suggest just the opposite. BU has turned twice as many double plays as its opponents, meaning the Terriers are probably generating more ground balls with which to turn those double plays. Indeed, the Terriers convert 9.52 ground balls into outs per game — tied with Maine for most in the league.
While the Terrier offense may be lacking in pop, the relevant cliche this year may well be, “Pitching wins championships.” Pitching and defense, rather. As BU softball looks to do what most people expected the team to do last year — win the America East Championship — it should keep in mind the last game of the 2007 season, a 7-2 loss to Hartford, in which the Terriers were held to two hits.
Now that’s a small sample size.
Matt Whitrock, a sophomore in the College of Arts and Sciences, is a weekly columnist for The Daily Free Press. He can be reached at [email protected].

